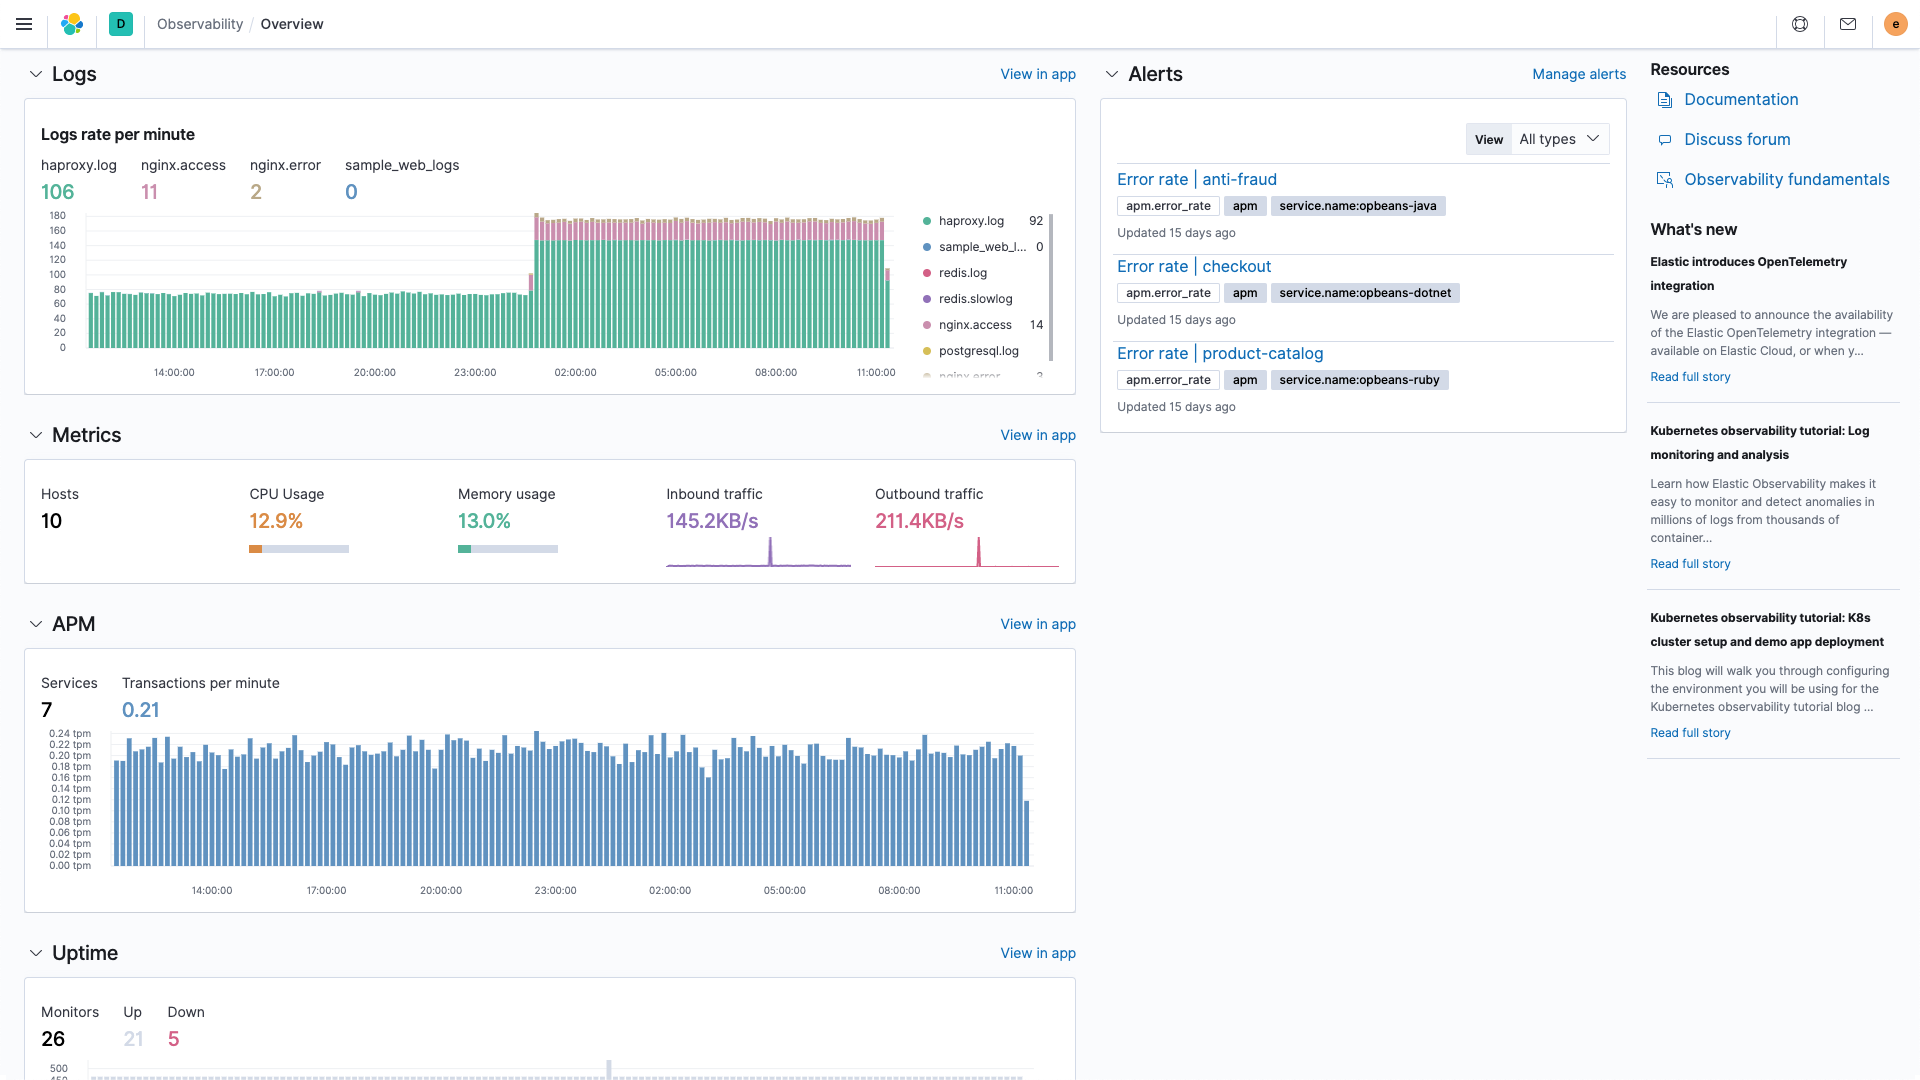

Log Management
A holistic visibility to errors, issues, patching, performance, compliance, and security turns to a challenge. How to monitor log & metric data from multiple systems in a cost-effective way?
Learn more
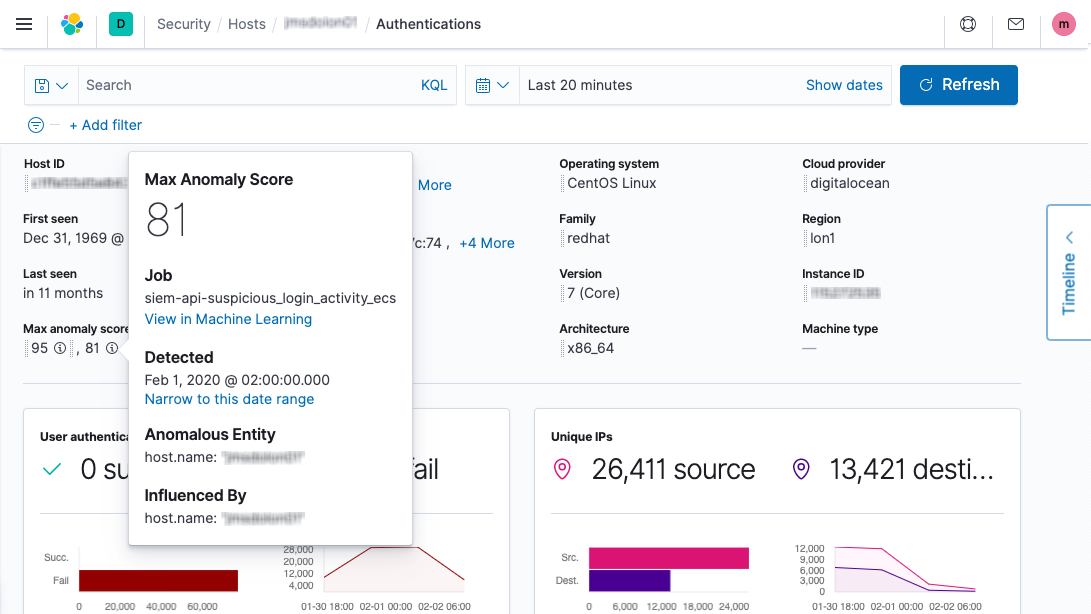
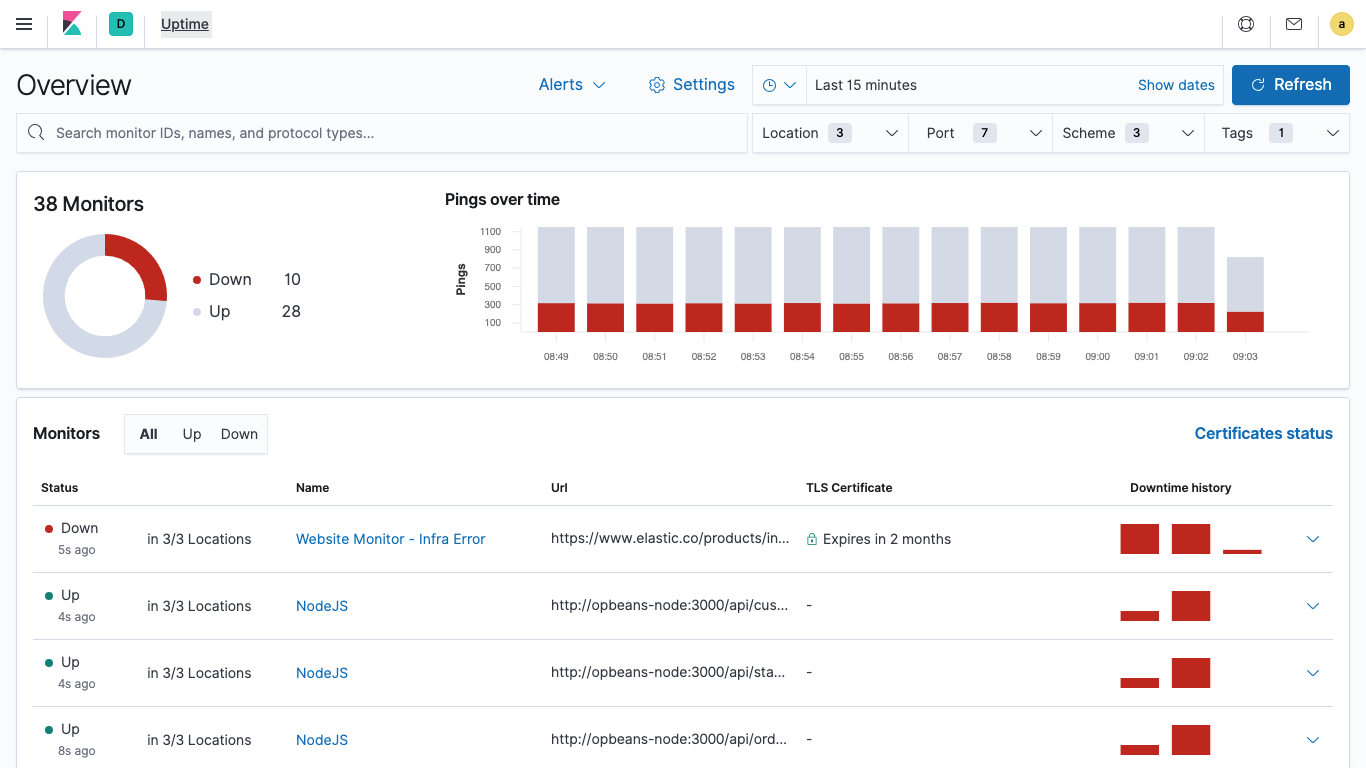
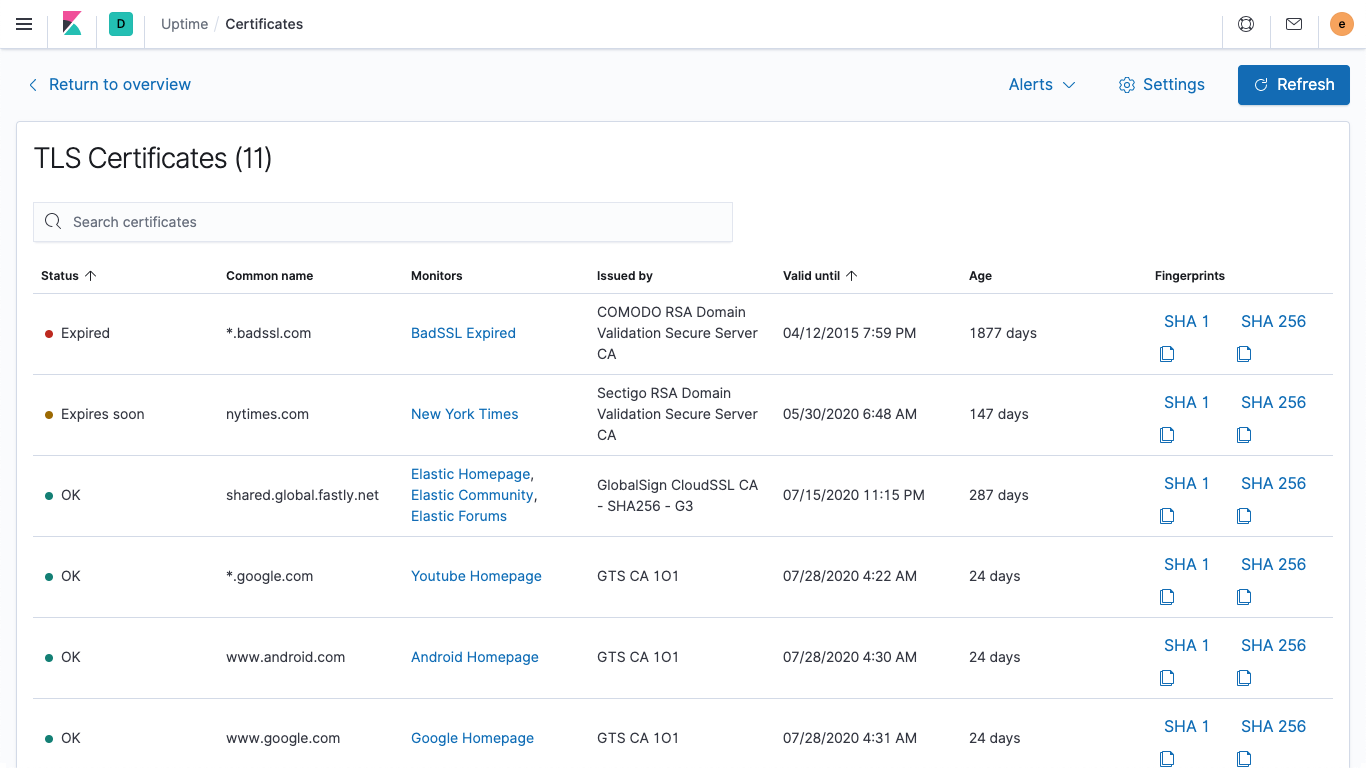
SIEM as a Service
Enable cost-effective anomaly detection and threat hunting with intuitive Elastic Security SIEM as a Service, and establish a holistic view to information across your environments.
Learn more

Business Migration to Cloud
Migrate your business to cloud by Lift & shift transform to cloud PaaS hosting, create a hybrid environment, or refactor your application code compatible with cloud.
Learn more